Why Calculating Your AI Search Share of Voice is Critical
Updated January 22, 2026

For SEO leads and brand marketers, the job is no longer finished when a page ranks. You also need to know whether your company appears inside the answer itself on ChatGPT, Perplexity, Gemini, and Google AI Overviews. To calculate share of voice in this environment, track a fixed set of prompts, record whether your brand is mentioned, cited, or recommended, and compare that rate with competitors.
A simple way to think about AI share of voice is this: it is the percentage of tracked prompts where your brand shows up in AI responses relative to the rest of the market. That market can be defined narrowly, such as three direct competitors for one product category, or broadly, such as every notable brand repeatedly surfaced for a topic cluster. The operational shift from broad visibility tracking to prompt-level AI Share of Voice is now widely recognized, with teams measuring how often a brand appears across a defined prompt set and expressing it as a percentage of total scanned prompts or responses, as explained in this AI visibility overview.
Traditional search share of voice and AI share of voice overlap, but they are not the same metric. Classic SOV looks at rankings, impressions, or click share in search results. AI, answer engines, and conversational search introduce a different question: when a user asks for advice directly, does the model mention you, cite you, compare you, or leave you out entirely? I think that distinction is where many reporting setups still fall short, because a brand can look healthy in SEO dashboards and still disappear inside generative engines.
Why Calculating Your AI Search Share of Voice is Critical
A brand can hold strong organic positions and still lose the customer decision moment if AI answers summarize competitors instead. That is why this metric matters now: users increasingly get recommendations before they ever see the full list of blue links. In practical terms, AI share of voice tells you how often your brand is included in the answer layer, not just whether you rank somewhere below it. For a deeper dive into the concept, you can explore this complete guide on what share of voice is.

The current market data reinforces the problem. NetRanks, citing AthenaHQ’s State of AI Search 2026 report, says the average brand mention rate is just 17.2%, which means the average brand is absent from roughly 82.8% of measured AI responses; their write-up on measuring AI share of voice is a useful benchmark for understanding how uneven this visibility still is. If I were prioritizing metrics for an executive dashboard, I would put this one near the top because it exposes whether your brand is entering the recommendation set.
A Practical Method for Measuring AI Search Visibility
What matters is not only presence, but the form that presence takes. A direct recommendation, a citation to your site, a mention in a comparison table, and a dismissive reference should not be treated as identical outcomes. In my view, the fastest way to improve the quality of reporting is to stop counting every appearance as equal and start recording context alongside frequency.
Real World Impact of Your AI Share of Voice Calculation
Consider a B2B software company that ranks first organically for a category term but is omitted from AI summaries for the same intent. The click opportunity shrinks because the user gets a shortlist before they ever browse the results page. This is why calculating SOV is not just an analytics exercise. It is a way to see whether your brand is being treated as part of the answer across share of voice in generative engines, share of voice in answer engines, and conversational interfaces.
How We Measure AI Search Share of Voice
A reliable methodology starts with a fixed prompt set, a defined engine list, a visible competitor set, and a clear collection window. In practice, that means choosing the exact prompts you will test, documenting which platforms are included, deciding which brands count as competitors, and rerunning the same set on a recurring schedule. If those inputs drift week to week, the numbers stop being comparable.
I would disqualify any measurement system that cannot show the original prompt, the timestamp, the engine tested, and the full answer snapshot. Without that evidence trail, you cannot verify whether a mention was real, whether it was a citation or a recommendation, or whether a sudden gain was caused by a changed prompt set. The best setups also preserve historical outputs so teams can compare how answers evolve over time instead of relying on a single screenshot.
A workable baseline for many teams is 30 to 100 prompts per topic cluster, measured weekly or monthly across ChatGPT, Perplexity, Gemini, and Google AI Overviews. That is usually enough to expose patterns without creating a research program too large to maintain. If your category is highly volatile or you are in the middle of a launch, a higher cadence makes sense; if not, consistency matters more than volume. This same workflow supports AI search share of voice benchmarking across engines and topics.
Gathering Data for an Accurate SOV Calculation
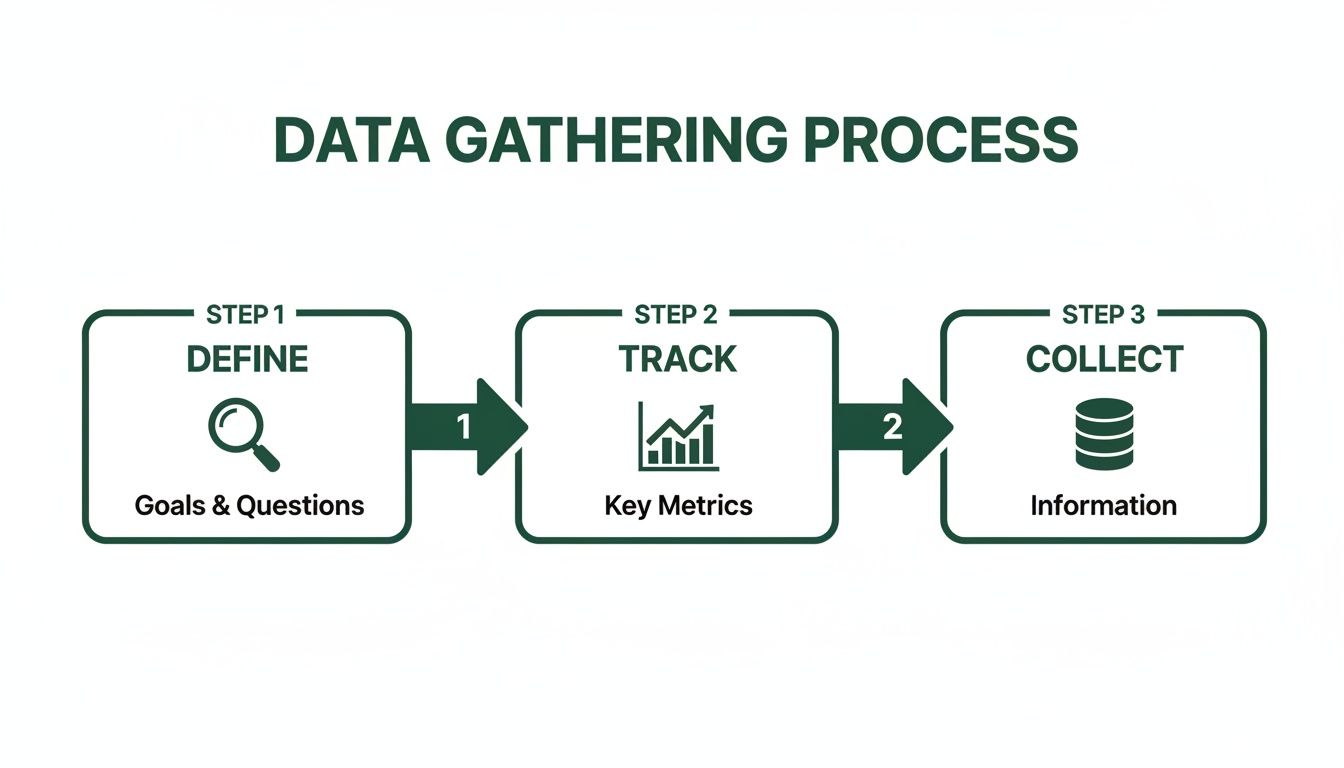
An accurate calculation depends on disciplined collection rules. Before you count anything, define five inputs: the prompt set, the engines tested, the competitor set, the mention types that count, and the cadence for reruns. This is the point where many teams go wrong. They gather a handful of ad hoc examples, then try to treat those examples as a benchmark. In my experience, that creates a nice-looking chart and a weak decision-making system.
Defining Your Tracking Parameters for SOV
Start by selecting the engines that matter for your audience. While ChatGPT is often the default, many teams also need Perplexity, Gemini, and Google AI Overviews in scope because the answer formats and citation behavior differ by platform. Then define competitors carefully. Include direct rivals, category leaders, and any publishers or marketplaces that repeatedly win mentions for your topics.
Next, specify what counts as a mention. Count a direct brand mention, a source citation to your site, an explicit recommendation, or inclusion in a comparison table or ranked list. Do not count generic category descriptions that imply your type of product without naming you. Also do not count old screenshots, copied responses, or analyst interpretation without the underlying answer attached. For more details on this, our guide on AI brand monitoring is a valuable resource.
Prompt Design for Consistent Measurement
Your prompt set should reflect the ways buyers ask questions. Use a mix of informational prompts such as problem framing or how-to questions, and commercial prompts such as tool comparisons, best-of lists, pricing questions, and vendor recommendations. Track branded and non-branded prompts separately. Branded prompts can tell you whether your own authority is intact; non-branded prompts are better for seeing whether the market includes you when a user has not named you yet.
Normalization matters. If one analyst asks for “best enterprise analytics tools for large B2B teams” and another asks “what software should I buy for reporting,” the outputs may vary for reasons unrelated to brand strength. Keep wording, language, geography, and account state as consistent as possible so your measurements are comparable over time.
Understanding LLM Tracking Challenges in Your SOV Measurement
Manual collection is possible at small scale, but it breaks quickly. A team tracking 50 prompts across four engines, two geographies, and five competitors is already dealing with hundreds of outputs per cycle. Beyond volume, the bigger challenge is answer volatility: models change, sources refresh, interfaces personalize, and location can affect what appears. Those are reasons to annotate your data, not reasons to avoid measurement.
Useful tools capture more than a raw mention count. They also record positioning, context, and source provenance so you can tell whether the model recommended a brand, merely referenced it, or cited it as evidence. That distinction is central to buyer-level analysis, and it is explained well in this guide to AI answer tracking. Limitations still remain, especially around personalization, geography, logged-in states, and rapidly changing answer formats, so any benchmark should be treated as directional rather than absolute.
The Practical Formula to Calculate Share of Voice
The baseline formula is still useful: (Your Brand Mentions / Total Market Mentions) x 100. It gives you a simple percentage of visibility across the market you are tracking. If your brand appears 24 times and all tracked competitors together appear 96 times, your SOV is 25%.
For AI search, though, a better method uses several layers instead of one count. I recommend separating the calculation into presence rate, citation rate, recommendation rate, and a weighted prominence score. That produces a measurement system that reflects not just whether you appeared, but how visible and persuasive that appearance was.
A Deeper Method to Calculate Your Share of Voice
Use the following step-by-step process:
- Count how many tracked prompts produced any mention of your brand.
- Count how many produced a citation to your owned site or content.
- Count how many explicitly recommended your brand as a best choice, top option, or suitable fit.
- Assign a weight based on prominence, such as first recommendation, top comparison entry, secondary list inclusion, or minor citation.
- Compare your totals with the same totals for competitors across the same prompt set and engines.
A simple weighting model can look like this:
- Mention present: 1 point
- Source citation: 2 points
- Explicit recommendation: 3 points
- First-listed or lead comparison position: +2 bonus points
This is not the only valid model, but it is practical. The goal is consistency, not theoretical perfection. It also maps well to generative search share of voice, conversational search share of voice, and broader LLM share of voice tracking workflows.
Inputs Needed for the Calculation
| Input | What to record |
|---|---|
| Tracked prompts | The exact prompt set used for testing |
| Engine tested | ChatGPT, Perplexity, Gemini, AI Overviews, or other platforms in scope |
| Competitor set | Named brands included in the benchmark |
| Mention count | Number of responses where each brand appears |
| Citation count | Number of responses citing the brand's site or content |
| Weighted score | Prominence score based on recommendation strength and placement |
How to Calculate Share of Voice: A Worked Example
Imagine a project management software company, TaskFlow, measures 20 prompts on ChatGPT and the same 20 prompts on Perplexity against ProjectPro and TeamSync.
On ChatGPT:
- TaskFlow appears in 8 answers
- ProjectPro appears in 12 answers
- TeamSync appears in 10 answers
- Total mentions: 30
TaskFlow’s mention-based SOV on ChatGPT is 8 / 30 x 100 = 26.7%.
On Perplexity:
- TaskFlow appears in 11 answers
- ProjectPro appears in 9 answers
- TeamSync appears in 8 answers
- Total mentions: 28
TaskFlow’s mention-based SOV on Perplexity is 11 / 28 x 100 = 39.3%.
Now add quality signals. Suppose TaskFlow receives 3 source citations and 2 explicit recommendations on ChatGPT, but 7 citations and 5 recommendations on Perplexity. Even before you assign weights, the business interpretation changes: TaskFlow is not just more visible on Perplexity, it is being used more often as evidence and endorsed more directly.
If you apply a simple weighted score:
- ChatGPT: 8 mentions + (3 citations x 2) + (2 recommendations x 3) = 20 points
- Perplexity: 11 mentions + (7 citations x 2) + (5 recommendations x 3) = 40 points
That kind of comparison is why engine-by-engine reporting matters. A single blended SOV number can hide the fact that one platform already favors your brand while another barely includes it. It also shows why teams increasingly want ChatGPT share of voice measurement and Perplexity share of voice tracking as separate views inside the same reporting model.
Tools to Measure Share of Voice in AI Search
A useful tool should do six things well: run a consistent prompt set, monitor multiple answer engines, retain historical snapshots, separate mentions from citations, benchmark competitors, and show source-level evidence. If a platform only gives a summary score without answer logs or citation details, it is not enough for serious diagnosis.
The buying question is not just “does it track visibility,” but “does it explain why visibility changed.” That means you want prompt-level outputs, source attribution, trend history, and enough structure to compare topics, engines, and competitors without rebuilding the dataset in a spreadsheet after every export.
Comparing Tools for Your SOV Calculation
Manual tracking is acceptable when the scope is small: maybe one topic cluster, a short prompt list, and a monthly review for an early-stage team. It can be a good way to pressure-test your methodology before you commit to software. I would still insist on a template that records prompts, timestamps, engines, mentions, citations, and screenshots so the process stays reproducible.
Spreadsheets break down when volume, cadence, or stakeholder expectations increase. Once you are testing across multiple engines, product lines, and competitors, the operational cost shifts from “can we log this?” to “can we trust this?” That is where platforms designed for AI visibility tracking become more valuable than general SEO tools.
When evaluating software, validate three things during a trial. First, confirm that the prompt set can be standardized and rerun consistently. Second, check whether the tool distinguishes a casual mention from a source citation or direct recommendation. Third, review the evidence layer: you should be able to inspect the original answer and understand which sources informed it. For teams that need this type of workflow, Riff Analytics is one option to consider alongside your broader measurement stack.
A practical buyer's framework is to compare tools against the actual reporting job:
| Capability | Why it matters |
|---|---|
| Prompt-set management | Keeps comparisons stable over time |
| Multi-engine coverage | Reveals differences between ChatGPT, Perplexity, Gemini, and AI Overviews |
| Historical snapshots | Lets you see whether gains persist or disappear |
| Mention vs citation labeling | Separates shallow visibility from source authority |
| Competitor benchmarking | Shows whether movement is market-wide or brand-specific |
| Evidence and sources | Makes findings auditable by content, SEO, and leadership teams |
That is the standard for tools to measure share of voice in AI search: they should support repeatable audits, preserve evidence, and make competitive shifts explainable.
| Metric Type | Traditional SEO Metrics | AI Search Visibility Metrics |
|---|---|---|
| Primary Goal | Achieve high keyword rankings | Secure brand mentions in AI answers |
| Key Indicators | SERP position, organic traffic, backlinks | Direct citations, source links, sentiment |
| Competitor Analysis | Tracking competitor keyword rankings | Monitoring competitor mention frequency |
| Tools Used | Ahrefs, Semrush, Google Search Console | LLM tracking tools like Riff Analytics |
How to Turn Your SOV Metrics Into Action
Once you have calculated your share of voice, the harder work begins. A standalone percentage is just a piece of data; its true value appears when you turn it into a strategic game plan. A score of 15% may not seem significant on its own, but knowing it is 5% higher than your closest competitor and grew by 3% last quarter provides valuable context, and with that context your SOV calculation can evolve from a simple report into a practical tool for refining your generative SEO strategy.
Benchmarking Your Share of Voice Calculation
The first step is to give your number meaning through benchmarking. You need to compare your score not just against competitors but also against your own past performance. Tracking SOV over time is the only way to spot trends before they become major threats or missed opportunities. If your SOV dips, you need to understand why. Perhaps a competitor launched a new content initiative that AI engines are now citing, or a new player has entered the market. At that point, go deeper with SEO competitive intelligence to understand the story behind the numbers.
Turning SOV Analysis Into Actionable Insights
Imagine your analysis shows a competitor is dominating the topic "AI powered automation tools." An actionable analysis digs into which sources AI engines are citing to give them that authority. In AI search, this means tracking not just if you were mentioned, but how prominently and in what context. By examining their top cited content, you can identify strategic gaps. Perhaps their guide uses outdated information or lacks practical examples. These gaps are your entry points to create content that is fresher, more useful, and better structured for LLM consumption.
If your roadmap includes paid distribution or category-defense planning, it is also worth watching how AI interfaces may evolve commercially; for that broader context, see Market With Boost. I would use SOV changes here as a prioritization signal: if one topic has low visibility but high recommendation intent, it deserves faster content and digital PR attention than a topic where you already dominate citations.
Adapting Your Strategy for the Evolving AI Environment
AI search is changing rapidly, which makes a nuanced interpretation of SOV more critical than ever. Teams should track visibility and referral potential across different AI interfaces rather than assuming one blended metric explains the whole market. That forces marketers to watch both brand inclusion and source citation behavior across ChatGPT, Perplexity, and Gemini. Ignoring those nuances means you are operating with an incomplete picture of the market.
Summary
Calculating and interpreting your share of voice is about moving from "what" to "so what." It is a continuous cycle of benchmarking against competitors, tracking your performance over time, and analyzing successes to identify your next opportunity. Modern tools provide the essential context to see not just your score but the reasons behind it, empowering you to build a smarter, more resilient generative SEO strategy. By focusing on clarity, accuracy, and authority, you can ensure your brand remains visible and relevant in the age of AI search.
Frequently Asked Questions
What is the best way to track share of voice for different AI engines?
Manually tracking mentions across multiple AI engines like ChatGPT, Perplexity, and Google AI Overviews is not scalable and is prone to errors. The most effective method is to use an automated LLM tracking platform like Riff Analytics, which provides consistent, reliable data.
How often should I calculate share of voice to spot trends?
For most businesses, calculating SOV on a monthly basis is ideal. This frequency allows you to spot meaningful trends and react to competitor actions without getting overwhelmed by daily fluctuations. For fast moving markets or during major campaigns, a weekly analysis may be more appropriate.
How does AI search visibility affect my overall marketing ROI?
Higher visibility in AI search directly translates to increased brand mentions and citations, which builds authority and trust. This can lead to more direct traffic, improved conversion rates, and a lower cost per acquisition as your brand becomes a recognized resource in your industry.
Should I measure share of voice by topics or keywords?
While keywords still have a role, a topic based approach is more aligned with how AI engines and generative SEO work. AI thinks in terms of concepts and entities, not just keywords. Grouping related keywords into broader topic clusters for your analysis will provide a more realistic view of your AI search visibility.
What is the difference between Share of Voice and Share of Market?
Share of Voice measures your brand's visibility and portion of the conversation within your industry, typically tracked through mentions or impressions. In contrast, Share of Market measures your percentage of total sales or revenue in the market. SOV is a leading indicator that can influence future market share.