Digital Marketing Analytics: A 2026 Guide
Updated November 14, 2026
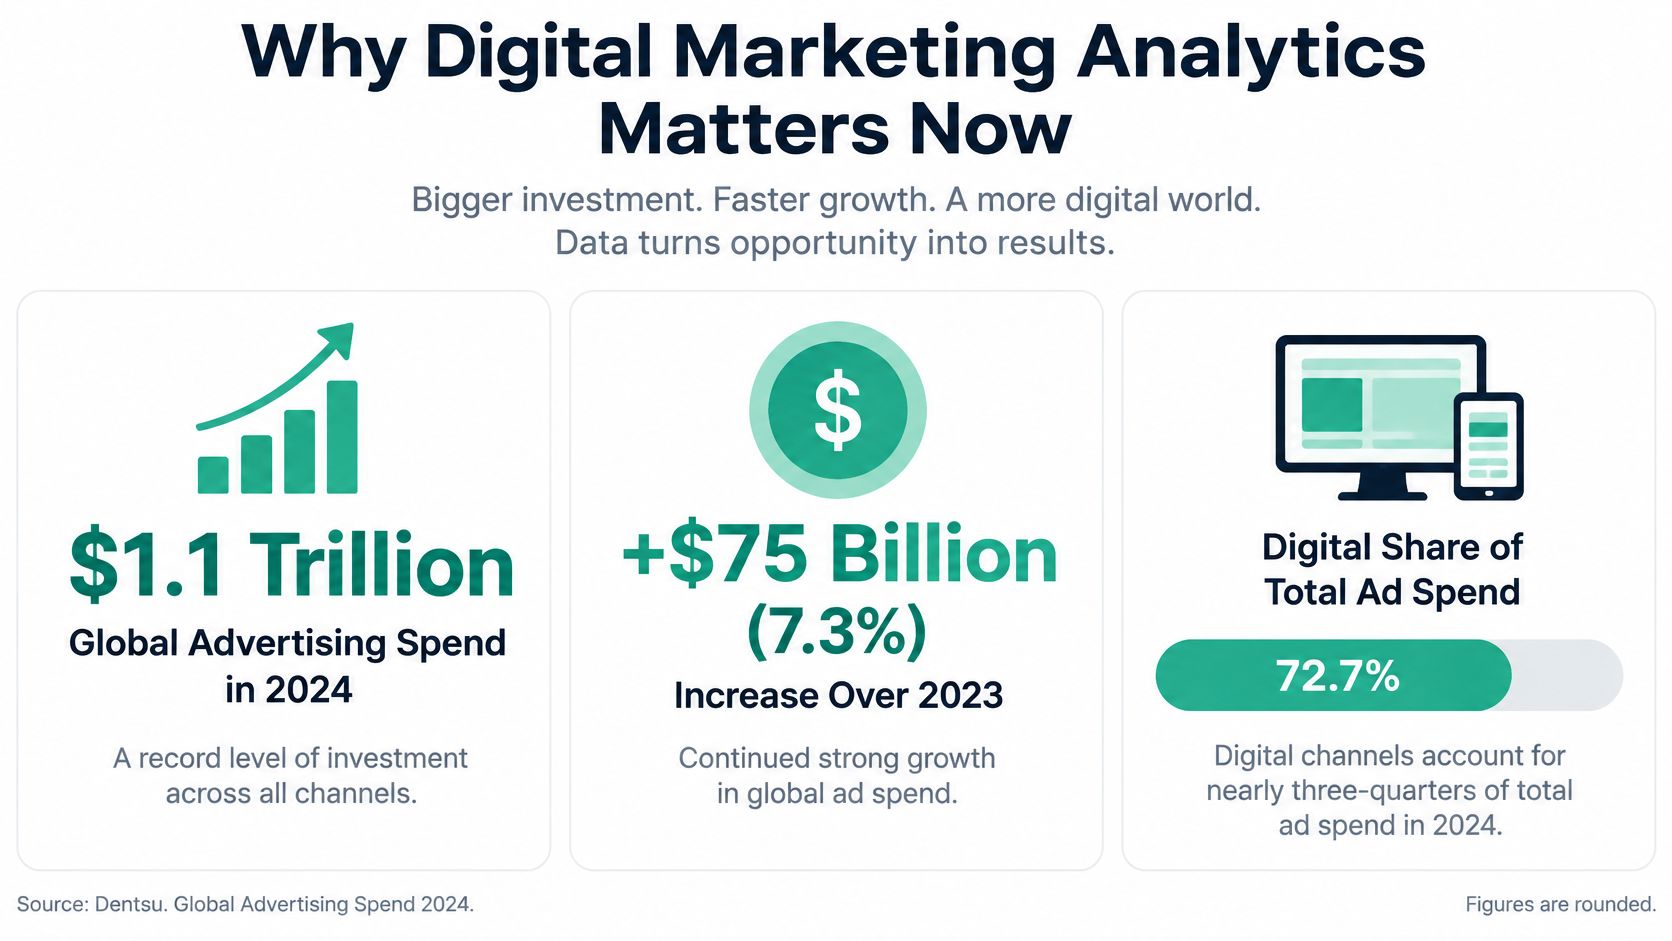
Global advertisers spent approximately US$1.1 trillion in 2024, up US$75 billion, or 7.3%, from 2023, according to DataReportal's global advertising analysis. Digital channels accounted for 72.7% of that investment, representing more than US$790 billion, while digital spending grew 10.3% year over year. At that scale, knowing where an ad appeared isn't enough. Marketers need to know what happened next, and which parts of the journey their reporting can't see.
Digital marketing analytics is the system that connects media investment, website behavior, and business outcomes instead of treating impressions or clicks as the result.
TLDR
- Separate the outcomes. Report visibility, visits, and revenue as different measures.
- Check attribution. Choose a credit model, then validate important spending decisions with an experiment.
- Reconcile conversions. Compare browser events with qualified leads and revenue in your CRM.
- Label aggregation. Document whether search reports use property totals or page totals.
- Track answer share. Measure AI mentions and citations separately because referral tags don't capture the full influence of AI recommendations.
Why Digital Marketing Analytics Matters Now
Say a software company runs search ads, publishes comparison pages, and hosts webinars. Its advertising dashboard reports conversions, its website dashboard reports demo requests, and sales reports fewer qualified opportunities than marketing expected.
Nobody necessarily made a calculation error. Each team may be counting a different action, applying a different attribution window, or recognizing revenue at a different point.
The job of digital marketing analytics is to make those differences explicit before someone reallocates the budget.
The spending figures above put the stakes in context.
A simple illustration shows why small improvements matter: applying a 1% efficiency improvement to the digital spending pool described by DataReportal would represent approximately US$7.9 billion in economic value. That's an illustration, not a forecast of savings. Actual savings or incremental revenue would differ by campaign, market, and currency.
Digital Marketing Analytics Needs Shared Definitions
A useful measurement system starts with agreement about what the business is trying to improve. For a subscription company, that might mean qualified pipeline and retained customers. For an online retailer, it might mean profitable purchases rather than traffic alone.
According to Nielsen's 2025 Annual Marketing Report announcement, only 32% of global marketers measured media spending holistically across digital and traditional channels, based on a survey of 1,400 marketing professionals.
The practical problem isn't a shortage of dashboards. It's the absence of a shared interpretation.
For the software company, a submitted form could be a website success without becoming a sales opportunity. A branded search could close a journey that started somewhere else. Neither result makes the original interaction worthless, but neither proves it caused revenue.
A measurement lead should therefore establish:
- A metric map. Identify which numbers represent exposure, behavior, and commercial outcomes.
- A model choice. State how channels receive credit and what evidence could overturn that interpretation.
- A visibility boundary. Record where consent, missing identifiers, or AI discovery prevent complete observation.
That gives marketers something more useful than another reporting interface: a basis for deciding what to change, what to test, and what remains uncertain.
Core Digital Marketing Analytics Metrics
Digital marketing analytics metrics and what they can claim
| Metric | What it counts | Use it to judge | Limit |
|---|---|---|---|
| Clicks | Visits from Google Search | Demand that arrived | Not the full journey or revenue |
| Impressions | Appearances in search results | Visibility | Property and page totals aggregate differently |
| Click through rate | Clicks divided by impressions | Whether the snippet earned the visit | A rise can come from fewer impressions |
| Average position | Topmost result from the site | A rough rank signal | AI Overview links share one position |
| Key events | Configured conversions such as leads or purchases | Outcomes | Sparse volume makes models unstable |
| Purchase revenue | Revenue on converting paths | Commercial result | Requires correct event values |
| Days and touchpoints to key event | Time and interaction count before the event | Journey length | Modeled paths, not a census |
| AI mention or citation share | Share of monitored answers that name or cite the brand | Leading AI search visibility | Not the same as referred sessions |
The search metrics follow Google Search Console's performance definitions: clicks measure arrivals from Search, impressions measure appearances, click through rate divides clicks by impressions, and average position describes the site's topmost result. Google also counts a clicked link inside an AI Overview as a click, while the overview occupies a single position shared by its links.
Read the table from exposure toward outcomes. Impressions show that a result appeared. Clicks show that someone selected it. Neither tells you whether the visitor became a valuable customer.
Say a product page gains impressions while clicks fall. Visibility increased, but the result earned fewer visits. Inspect the query mix, title, snippet, device, and search layout before concluding that the title alone caused the decline.
Digital Marketing Analytics Must Preserve Counting Rules
Search Console's aggregation level changes what totals mean. Under Google's property and page aggregation rules, multiple appearances from the same property on a results page can count as a single property impression, while unique URLs are counted separately in page reporting; qualifying repeat clicks are also aggregated differently.
Use property reporting for overall brand visibility and page reporting for URL diagnosis. Don't add those totals together or interpret URL activity as additional people.
For business outcomes, define key events as configured actions that matter, such as a completed lead submission or purchase. Purchase revenue represents the recorded revenue associated with purchases; days and touchpoints to key event describe elapsed time and interactions before the outcome.
Digital Marketing Analytics Needs an Answer Share Line
Average position can't show which cited source was most prominent within an AI Overview. Generative SEO and LLM tracking therefore need their own measures.
Define mention share as the proportion of monitored answers naming your brand. Define citation share as the proportion citing your content, and document the prompt library, engines, markets, and denominator.
A practical SEO performance measurement framework should retain those distinctions. Label every scorecard row as visibility, behavior, or answer share before comparing reporting periods.
Digital Marketing Analytics Models That Assign Credit
Attribution answers a narrow question: how should recorded outcomes be distributed across observed interactions? It doesn't automatically answer whether a campaign created additional demand.
Start with the journey rather than a channel leaderboard.
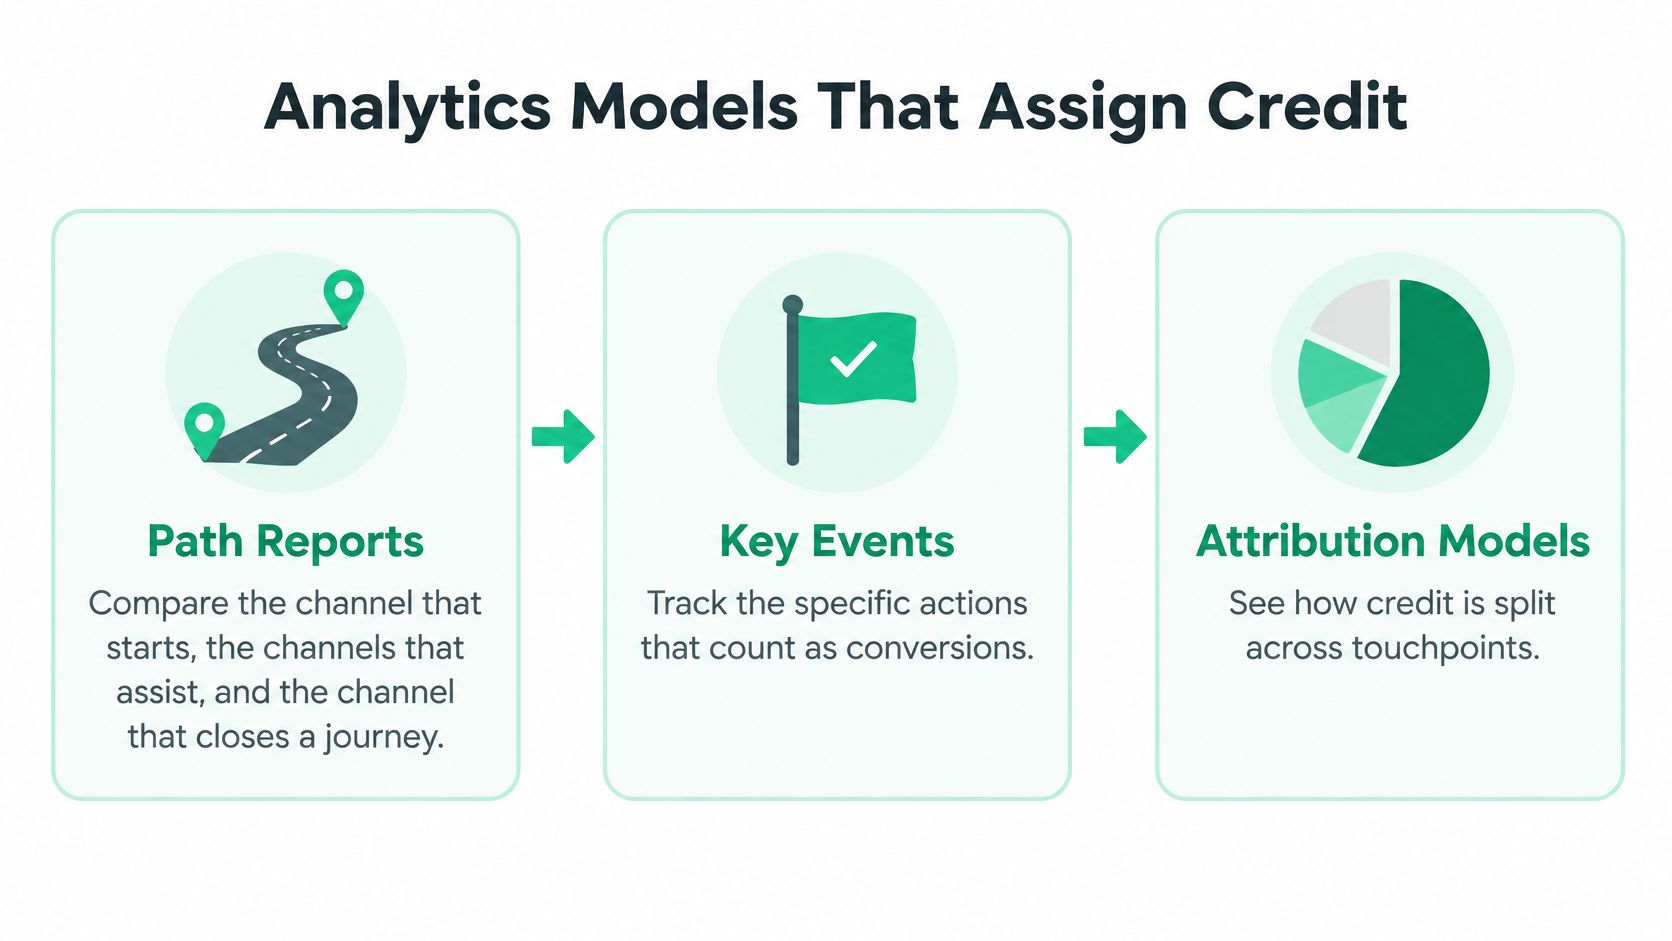
Google Analytics' Attribution paths documentation describes reports that distinguish channels that initiate, assist, and close key events. Use those paths to inspect sequence alongside the outcome and journey measures in your scorecard.
A B2B SaaS buyer might discover a comparison article, attend a webinar, read reviews, return through email, and request a demo through a direct visit. Giving the closing interaction all the credit would hide much of that observed consideration process.
The diagram separates the recorded actions from the rules used to distribute credit.
Digital Marketing Analytics Attribution Isn't Causal Lift
GA4's data driven attribution evaluates converting and nonconverting paths, considering signals such as interaction timing, device, exposure sequence, and creative format. It estimates how an interaction changes conversion probability rather than assigning a fixed weight to each position.
Google's data driven attribution guidance states that the approach generally requires at least 600 conversions within 30 days. A low volume B2B program shouldn't treat sparse modeled allocations as precise evidence.
Keep paid and organic last click beside the modeled result. If channel credit shifts substantially, inspect tagging, campaign changes, and path availability before moving money.
Budget rule: A model can suggest where to investigate. A holdout or geographic experiment is what you use to test whether the spending creates additional outcomes.
This matters when evaluating channels that may assist rather than close. Grou's guide to Reddit ads and native content offers useful campaign context for planning such interactions, but your measurement design still needs to distinguish engagement from incremental qualified demand.
Digital Marketing Analytics Cohorts Test Customer Quality
Cohort analysis asks a different question: were the acquired customers worth acquiring?
Group customers by acquisition campaign or period, then follow repeat purchases, retention, and expansion. Compare cohorts at similar ages so an older group doesn't appear stronger because it has had longer to generate revenue.
A campaign can receive substantial attribution credit while attracting customers who leave quickly. Conversely, a modest acquisition source may bring customers who remain and expand.
Use paths to understand sequence, experiments to establish incrementality, and cohorts to judge customer quality. These methods complement one another rather than competing to produce a single perfect attribution number.
Digital Marketing Analytics Data Sources Compared
In 2025, 69% of marketers surveyed by Brandwatch reported using website and app analytics, making it the most used data collection method in that survey. Adoption doesn't make any particular dashboard the authority for every question.
Which digital marketing analytics source answers which question
| Source | Best question | Known limit | Anchor figure or rule |
|---|---|---|---|
| Website and app analytics | What happened on the site after arrival? | Consent and cookie loss | The adoption figure above describes surveyed marketers |
| Ad platforms | What did this platform spend and claim? | In platform credit bias | Each platform reports within its measurement rules |
| CRM and revenue | Which leads and revenue closed? | Match rate to clicks | Tie breaker for money |
| Search Console | Which queries showed and earned clicks? | Property versus page aggregation | AI Overview links share a position |
| Modeled or privacy reporting | How many conversions remain measurable without user level IDs? | Ranges, not a person journey | MiQ's test illustrates attainable coverage |
| AI answer monitoring | Is the brand named, accurate, and cited? | Not a referrer or a session | Leading indicator, then validate commercial outcomes |
Website analytics should diagnose landing pages, event completion, and on site friction. It shouldn't overrule the CRM about whether a lead qualified.
Ad platforms are the operational source for delivery and spend. Their conversion claims need reconciliation because platforms may apply different windows and credit rules to the same purchase.
CRM and revenue systems should resolve commercial questions, provided sales stages, duplicates, refunds, and revenue recognition are handled consistently. Search Console owns a different question: how your pages appeared in search and earned clicks.
Digital Marketing Analytics Coverage Isn't Identity
In a Google Privacy Sandbox case study, MiQ reported capturing 85% of the same unique converters identified by third party cookies, plus an additional 3.7% of converters that cookies didn't capture. That's a vendor test result under particular conditions, not a universal coverage benchmark.
Don't treat aggregated or modeled conversions as reconstructed individual journeys. Report observed and modeled totals separately, and inspect match rates and uncertainty ranges by device, market, and campaign type where available.
- Keep definitions stable. A qualified lead must mean the same thing in browser reporting and CRM reconciliation.
- Preserve measurement differences. Don't merge aggregated estimates and identified transactions as though they have identical error.
- Assign ownership. Name the source that settles each business question before the budget meeting.
Digital Marketing Analytics Sources Include AI Answers
AI answer monitoring covers a separate layer across ChatGPT, Gemini, Perplexity, and Google AI Overviews: mentions, cited sources, response context, and competitor gaps. It shows what buyers may encounter, not how many sessions occurred.
At Riff Analytics, we're designed for SEO and content teams adding AI tracking to their existing SEO stack and connecting content updates with visibility changes.
When evaluating a marketing intelligence platform, prioritize source ownership and reconciliation over dashboard breadth. More connected feeds won't fix incompatible definitions.
How to Set Up Digital Marketing Analytics
Build the initial implementation around decisions your team already makes. Audit existing tags, consent behavior, campaign naming, and CRM fields before buying additional infrastructure.
The operational foundations are straightforward.
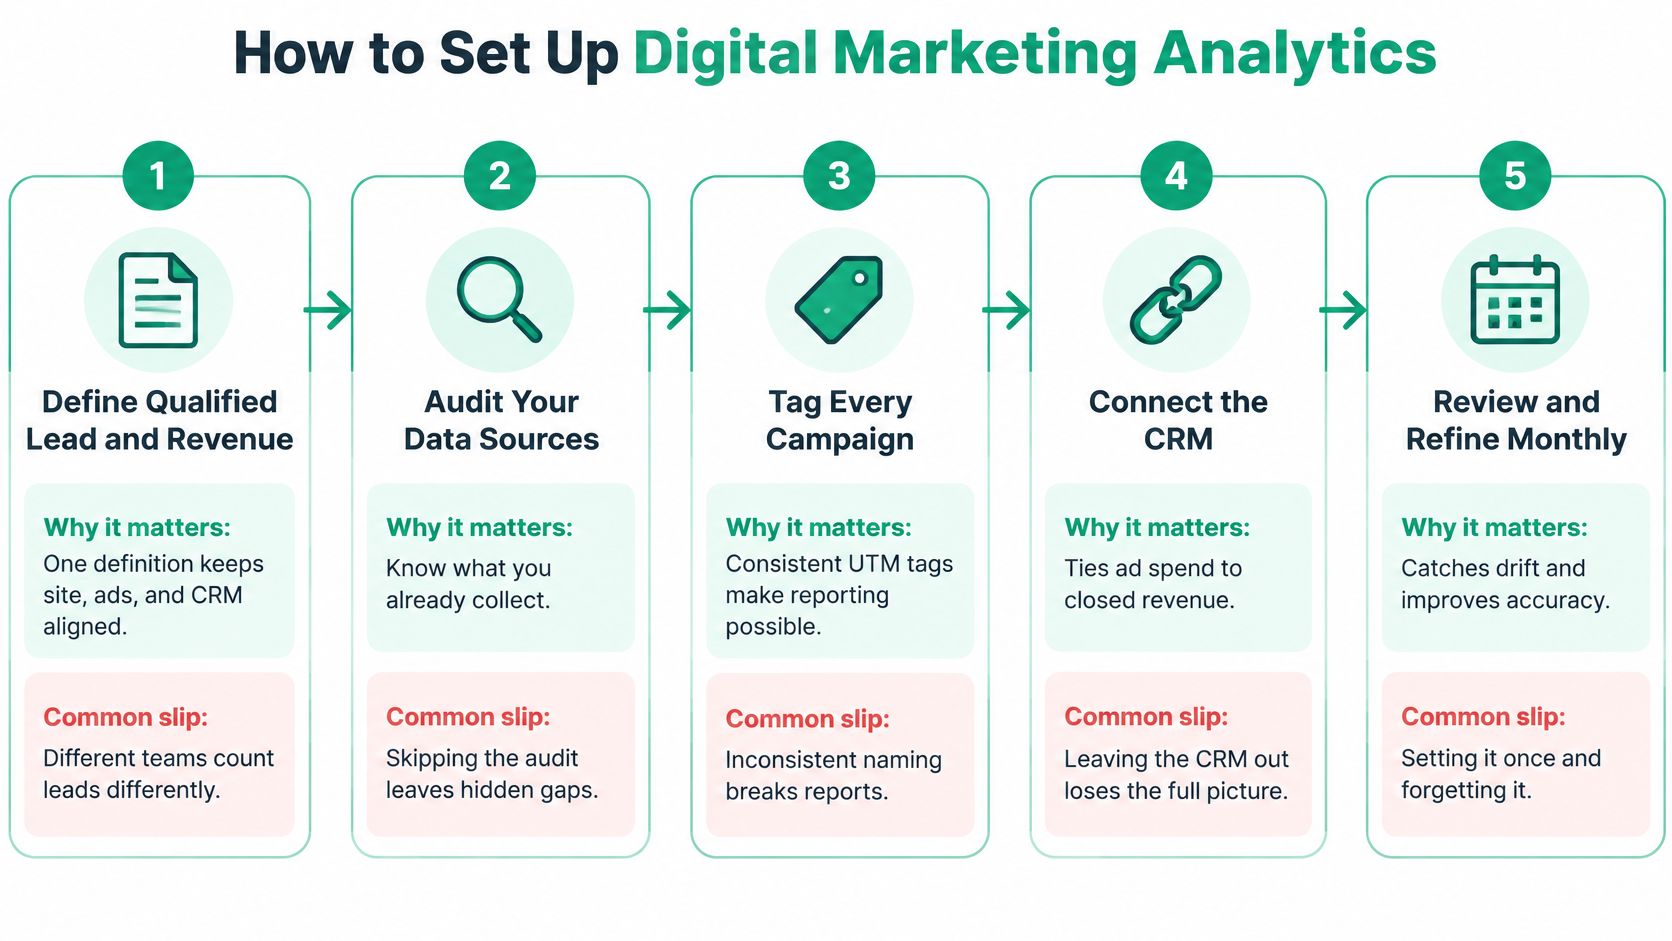
Agree on qualified leads and revenue. Write the accepted definitions and assign owners from marketing and sales. Specify whether a lead requires a completed form, qualification, or an accepted opportunity. The common slip is calling all those stages conversions without distinguishing them.
Instrument completed actions with stable metadata. Test successful submissions and purchases, not just button clicks. Standardize campaign source, medium, and campaign names so aggregated reporting remains usable. Inconsistent naming can split the same initiative across several rows.
Choose the reporting level before calculating rates. Record the aggregation level, filters, market, device, and reporting period beside the metric. The failure mode is comparing reports that look alike but count different units.
Digital Marketing Analytics Setup Needs Validation
Configure path comparisons before relying on modeled credit. Keep last click available as a comparison and check model suitability against Google's conversion volume guidance. Don't switch reporting methods and interpret the resulting credit change as business growth.
Plan a holdout before a major budget move. Choose comparable geographic areas or eligible audiences, define the outcome, and agree on the evaluation method before launch. Changing targeting and landing pages during the test makes the result harder to interpret.
Add an AI visibility loop beside SEO. Build a fixed prompt library from buyer questions, define your brand and competitors, and monitor on a consistent schedule. Defining those entities is step two of our LLM tracking workflow; step four uses AI brand visibility dashboards and trend reports to connect content updates with metric changes. The common slip is changing prompts whenever results disappoint, which removes a stable comparison.
Review the scorecard weekly and record blind spots. Keep visibility, behavior, and answer share as the headline lines, with CRM outcomes under behavior. Add an action, owner, and evidence note when something changes. Don't turn every fluctuation into a campaign decision.
First deliverable: Produce a scorecard that fits on a page, with agreed definitions and named owners. Build additional infrastructure only when a specific unresolved question requires it.
Document content releases, event fixes, and campaign changes alongside reporting. Otherwise, a measurement repair can look like a performance improvement, and a content update can receive credit for an unrelated demand shift.
Digital Marketing Analytics Mistakes With AI Search
Only 8.8% of visits influenced by an AI recommendation arrived directly through an AI referral, while 55.9% arrived through search, in a Similarweb panel of U.S. desktop users from July through December 2025, as reported by PPC Land. Search arrivals often followed a later branded query.
That's a measurement design problem, not evidence that AI discovery doesn't matter.
A familiar reporting mistake is trying to resolve that uncertainty by opening more traffic dashboards.

A buyer can discover a vendor in an AI answer and later search for its name. The eventual visit may appear as organic search or direct traffic, without preserving the original recommendation.
Don't relabel all branded traffic as AI influenced. Instead, compare referral data with branded query trends, assisted conversions, unusual direct traffic patterns, and self reported discovery answers. Use geographic or audience experiments when the commercial decision warrants stronger evidence.
Digital Marketing Analytics Must Check Answer Quality
Counting mentions alone creates another failure mode. An answer can name your brand while describing an outdated product, citing an unreliable source, or making an unsupported claim.
The NIST Generative AI Profile recommends selecting metrics for significant risks, documenting risks that can't be measured, and testing system capabilities and limitations. Apply that discipline to brand monitoring rather than treating every appearance as success.
- Accuracy. Does the answer describe the product and its capabilities correctly?
- Citation quality. Does the cited page support the claim?
- Response context. Is the brand recommended, dismissed, or merely listed?
- Known limits. Which prompts, markets, engines, or answer variations weren't observed?
Use the video alongside a practical review of how your team interprets AI visibility and downstream behavior.
Digital Marketing Analytics Shouldn't Price Every Mention
Answer share is an exposure measure within a defined monitoring sample. It isn't revenue, and a rise doesn't establish that buyers changed their behavior.
Keep mention and citation trends beside commercial measures without collapsing them into a fabricated attribution total. Look for a plausible sequence: content changes, relevant answer changes, branded demand movement, and qualified outcomes.
If answer share rises while branded search doesn't, investigate the query set and buyer relevance before claiming commercial impact. The monitored prompts may describe topics your audience rarely uses to choose a vendor.
Apply Digital Marketing Analytics This Quarter
A useful summary comes down to four decisions:
- Choose a compact scorecard. Put visibility, behavior, and answer share on the same page without treating them as interchangeable.
- Match evidence to the decision. Use paths for sequence, holdouts for major spending questions, and cohorts for retention.
- Resolve counting disagreements. Reconcile browser conversions with CRM outcomes and keep incompatible search totals separate.
- Treat referrals as partial evidence. Investigate later branded behavior rather than equating tagged arrivals with total influence.
For teams already collecting web analytics, the next useful addition is a stable buyer prompt library. Watch whether citation changes precede branded demand, then connect qualified outcomes to your approach for measuring content marketing ROI.
What Is Digital Marketing Analytics in Simple Terms?
Digital marketing analytics connects media spending, on site actions, and revenue so marketers can change their channel mix using evidence. It also records what the available measurement can't establish.
How Is Digital Marketing Analytics Different From Web Analytics?
Web analytics focuses on website and app activity. Digital marketing analytics also includes advertising, CRM outcomes, experiments, customer quality, and AI answer share.
Which Digital Marketing Analytics Metrics Matter for AI Search Visibility?
Mention share, citation share, answer accuracy, and later branded search or qualified lead movement matter more than average position alone. Keep the monitoring sample consistent so changes remain interpretable.
How Often Should a Team Review Digital Marketing Analytics?
Review the headline scorecard weekly, while allowing enough time for the business's sales cycle. As an operating recommendation, refresh prompts and content every 60 to 90 days, preserving a stable baseline for comparison.
Build your first scorecard, then establish an AI visibility baseline. At Riff Analytics, our plans include AI visibility tracking, citation gap analysis, and competitor benchmarking. Request our free AI visibility report or start the 7-day free trial of our ChatGPT Brand Visibility Tracker, then use the results to identify the buyer questions and citation gaps your team should investigate first.